
by Chris Hargreaves | Nov 14, 2022 | News, Power Factor
Ever felt ripped off after being served up a beer with more head than you can shake a stick at? Then take a moment to consider how power wastage from your business’ equipment is as useless as the froth on your over-fizzed brew.
But what on earth has power factor got to do with beer I hear you say? And more importantly, what even is it?
Power factor in a nutshell… or a pint glass
Power factor is basically a measure of how efficiently your business sites use power supplied by your network distributor. Poor power factor = poor power efficiency and increased charges.
But for a more detailed, um, ‘scientific’ explanation, let’s get back to that beer:
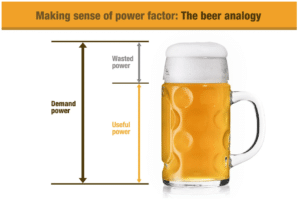
Beer = active power (kW) – the useful power, or the liquid beer is the energy doing the good work.
Foam = reactive power (kVAR). This is wasted or lost power. It’s the energy being produced that isn’t doing any work and is annoyingly inefficient.
The mug = apparent power (kVA). This is the demand power, or the power being delivered by the utility.
So, the more ‘foam’ on your power factor, the more power wastage and the higher your inefficiency. Poor power factor is bad news for your business, your carbon footprint, and the environment.
Power factor is expressed as a percentage – the lower the percentage, the less efficient your power usage.
For example, equipment with a power factor of 1 is using all the power supplied to it. Big tick. Generally, a power factor of 0.8 or above is considered good.
However, if your power factor is lower than 0.8, it should be corrected to save on consumption and comply with the requirements of the electricity network operator.
Paying hand over fist for power
Total Utilities Director Chris Hargreaves explains, “Your power supplier provides electricity to meet your demands. Therefore, if your apparent power needs are high in order to compensate for poor power factor, you – the customer – will end up paying through the nose for it.
“For some larger customers, power suppliers might even take the largest peak and apply it across the full billing period. So you’re paying a very high price indeed for that froth on your beer!
“Poor power factor can also cost your business through direct penalty charges applied by many electricity distributors in New Zealand. This combined with charges for apparent rather than actual power can result in sky-high utility bills – particularly in this current climate where the cost of power is going through the roof.
“Conversely, by reducing the amount of energy your site requires at any one time, you reduce demand and the cost of supplying energy to your site.”
So, how do I get a handle on my business’ power factor?
Before you start to tackle a power factor problem, it’s important to get a measure of how efficient your current equipment actually is.
Total Utilities provides power factor audits – complete health checks of the overall quality of your electrical network. Our power factor audits identify problem areas and suggest opportunities for improvement in order to maximise your energy savings, mitigate faults and increase system reliability and efficiency.
Total Utilities can save you money with power factor correction
If a problem is identified during our audit, installing power factor correction is a great option to reduce your demand charges.

Total Utilities works with Rotorua based power factor correction specialists KVAr Correct, to provide complete, custom, and ready-to-go power factor correction solutions, plus ongoing monitoring and maintenance. These modular systems are custom designed to meet each customer’s need, ensuring the best return and no wasted capacity.
So, if you’re looking to reduce costs and increase energy efficiency (and let’s face it, who isn’t?), maybe now’s the time to look into your power factor? Use less. Pay less. Reduce your carbon footprint.
It’s a win-win for your business, your bottom line and the planet.
Sign up below for Total Utilities Market Commentary to receive all the latest market news and insights.

by Chris Hargreaves | Oct 11, 2022 | Company News, News
Total Utilities is proud to announce it has been recertified as a net carbonzero organisation by Toitū Envirocare – showing our continued commitment to taking positive action against climate change.
Our recertification proves that we continue to walk the talk by accurately measuring emissions, reducing greenhouse gases and neutralising our unavoidable emissions.
World leading Toitū standard
The Toitū net net carbonzero programme ensures businesses are accurately measuring gas emissions and putting in place strategies to manage, reduce and offset their impact. Total Utilities is proud to meet the ISO 14064-1:2018 standard.
Toitū Envirocare has a world leading certification programme, with certification requirements meeting and exceeding international standards and best practice.
Good business sense
Total Utilities Director, Chris Hargreaves says, “We at Total Utilities are passionate about business sustainability so the Toitū recertification is particularly pleasing.
“Setting our carbon reduction targets is not just about reducing our environmental impact, it makes good business sense.”
Chirs points out the benefits of net carbonzero certification for businesses, including the reputational advantages of being a good corporate citizen – both to potential customers and other organisations who want to do business with you.
Carbon reduction not only means you gain a moral and reputational advantage, but you can also identify business efficiencies and cost savings as part of the process.
Furthermore, employees that work for sustainable organisations see improvements in staff engagement and retention, and also attract higher calibre employees.
Total Utilities can help you make a plan to reduce emissions and work towards net carbonzero certification. Our services will help you to:
- Understand the scope of your challenge by baselining greenhouse gas emissions.
- Create a credible, actionable roadmap with a multi-year, net zero pathway using science-based methodologies.
- Lock in immediate and long-term gains with our range of services and solutions to deliver your pathway.
Reduce business risk by adhering to today’s environmental regulations and being prepared for future legislation.
Contact us to find out more about our energy management consultancy services.
Sign up below for Total Utilities Market Commentary to receive all the latest market news and insights.
by Chris Hargreaves | Oct 7, 2022 | Carbon Sustainability, Energy, News
With prevailing energy market conditions causing sharp price hikes that show no signs of abating – what can you do and who do you turn to for advice and viable solutions?
Since the beginning of 2021, negotiated contract pricing for large commercial customers has increased from 11c/kWh to 18c/kWh for a three year period. This means a customer using one million kWh per year is paying $70,000 more for electricity per year than 19 months ago.
Mass market customers have not been impacted to the same degree with pricing moving from 9c/kWh to 12.5c/kWh.

Rather than bore you with the (too numerous) details and interrelated factors that have caused this unwelcome turn of events, let’s explore the options open to businesses to mitigate sky high energy costs.
Time to turn to the experts?
Many businesses are turning to energy management consultancies to help them navigate the challenging energy markets and provide services to assist them to get the very best deal on their utilities.
They are also hiring consultants to explore sustainable and renewable energy options to help them diversify their energy portfolio and give them maximum bang for their buck in terms of energy efficiency, pricing and carbon liabilities.
But according to Total Utilities Director Chris Hargreaves, it’s a case of ‘buyer beware,’ when it comes to hiring an energy management consultancy. He says the quality of service and outcomes vary dramatically.
“If it was my business, there are only a small handful of organisations I would consider using in New Zealand to obtain energy contracts on my behalf and to have the ability and insight required to properly explore efficiency and sustainable solutions.
“The consultancy industry for energy is not regulated, so effectively anyone can start up a business that offers procurement services,” he says.
Chris advises considering various factors before hiring a consultant, including how many procurements they conduct each year. The energy market is highly dynamic and energy retailers are entering and leaving the market at unprecedented rates and pricing models and practices are changing daily.
If the consultant or advisor you are using is not pricing in the market on a regular basis, then you are likely to get caught out by the market changes. Look for companies conducting over 100 procurement exercises per year (as an example, we average almost 350).
You should also establish whether your consultant reviews the entire market of energy retailers for pricing (we do), or just their favoured few companies (nope, not us).
Also, does your advisor or consultant gather detailed market intelligence to track wholesale pricing and industry developments? Do they warn you of potential ‘gotcha’ clauses to look out for in energy contracts as part of their procurement process? Needless to say, Total Utilities ticks all these boxes.
Aside from engaging a reputable energy management consultancy to help you traverse choppy utility waters, Chris explains there are various ways to hedge against rising costs, to minimise budgetary risk and ensure you comply with regulatory requirements.
Cost saving starts with sustainability & efficiency
He says that first and foremost, now is the time to explore efficiency, sustainability, and low carbon solutions to increase resiliency.
“By exploring sustainable solutions such as LEDs, Renewable Energy Certificates, solar and energy conservation methods, you can achieve short term wins and relief from volatile energy prices, whilst also unlocking long term sustainability benefits and future proofing your business.
“Sustainability not only saves money by creating energy efficiencies, it also decreases your reliance on the grid, so you are no longer at the mercy of volatile energy prices,” he adds.
Keeping the lights on
One of the trends we’re seeing in the industry is a move away from centralised, utility based generation – to so called ‘distributed generation.’ This is a shift from a single source to many sources to allow for increased resiliency and reduced reliance on the grid.
For example, traditionally if the grid goes down, you have no real option to keep your business going. But if you have solar with battery storage, you might be able to keep the lights on until the grid comes back online.
Additionally, you avoid the full impact of market volatility if your energy sources are distributed – it goes back to the wisdom of the old proverb, ‘don’t put all your eggs in one basket.’
Talk to us
A great place to start when it comes to navigating the ever-changing energy markets is to talk to our team at Total Utilities. Our data-driven approach, born out of comprehensive investigations and analysis, allows us to carefully tailor energy services and solutions to your business.
With our proven 20 plus years in the energy business, we negotiate over $400 million worth of energy contracts for our clients every year. We can leverage relationships to get you better prices.
Our detailed pricing analysis and tendering services help save time and money by pinpointing the best possible energy contracts and ensuring the most favourable terms and prices.
We put sustainability, cost saving and energy efficiency at the heart of our clients’ businesses, so that they can be both sustainable and highly profitable.
And in this environment, setting sustainability and carbon reduction targets isn’t just about reducing your environmental impact – it simply makes good business sense.
Contact us to find out more about our energy management consultancy services.
Sign up below for Total Utilities Market Commentary to receive all the latest market news and insights.

by Chris Hargreaves | Aug 18, 2022 | Company News, News
We are excited to introduce a new face to the Total Utilities team with Executive Administrator, Komal Mathew, recently joining us.
Komal has a wealth of experience in the energy sector, having worked in energy coordination roles for the past 10 years.
Her role will involve providing administrative support to our experienced team of directors, as well as assisting with projects on the go. She will be a regular contact point between the team and our customers.
She has hit the ground running and is responsible for customer support, sales and marketing support, procurement support and energy sensor stock control.
Komal says, “Luckily, with my energy background I already understand a lot of what I need to know for this role, so I’m looking forward to using my knowledge to become a helpful and productive member of the team.”
Komal moved to New Zealand from South India back in 2009 and is very happily settled here with her husband and young family.
She has two children, aged 10 and 3, and she loves nothing better than hanging out with them and taking them to the local park. Her hobbies include Indian cookery and she is known for her delicious curries – “My husband loves them, so I think they must be good!” she says.
Komal has an outgoing personality and loves to ask questions to get to the bottom of any issue. She says she immediately felt welcome by the Total Utilities team and is very excited to be starting in her new role.
Please join us in welcoming Komal.

by Chris Hargreaves | Jun 22, 2022 | Carbon Sustainability, News
The release of New Zealand’s first Emissions Reduction Plan sets new urgency around our country’s transition to a carbon-zero future and means slashing 11.5 million tonnes of carbon equivalent off our emissions by 2025.
The plan reveals how the Government will meet New Zealand’s first emissions budget of 72.4 million tonnes a year and underlines the fact that there is no more time for business as usual when it comes to decarbonisation. And if greenhouse emissions and tonnes of carbon don’t mean a lot to you, picture this; 1 tonne of CO2 would fill 1 large hot air balloon (almost 3,000 cubic metres in volume), and to capture 1 tonne of CO2 emissions, approximately 50 trees must grow for one year. The challenge is real.
Strategic urgency for decarbonisation
During the last 12 months, the conversation has shifted from decarbonisation being a tactical compliance thing for businesses – to having real strategic urgency.
As Total Utilities Director, Chris Hargreaves explains, “Addressing carbon is becoming a business problem and not an optional extra.” “Creating a low carbon economy requires considerable planning,” says Chris. “Businesses will need to be adaptable and flexible to meet the Government’s emission budgets and reduction plan and they will need to have a plan to mitigate risks associated with it. “Carbon units will become more expensive over time, increasing the cost of goods and services with high carbon intensity.”
Protect your brand & reputation
The benefits for businesses that address carbon now are huge. Think of the cost savings of needing less energy to run your business and reducing your energy requirements now to mitigate future cost increases. Decarbonisation also means protecting your brand and reputation as more customers turn to sustainable companies.
Furthermore, it gives you a head start in bidding for contracts, with many businesses now asking for details on approaches to sustainability and emission reduction before awarding contracts. And front of centre of it all, of course, is the environmental imperative to reduce emissions. Science tells us we need net zero emissions to limit temperature rises to 1.5°C, and the race to get there by 2050 has started. So why aren’t businesses moving faster? Chris says that clients who come to him for advice know they need to do something but often don’t know what to do or where to start.
Total Utilities can help…
This is where Total Utilities comes in. Having worked in New Zealand’s energy market for well over 20 years, we specialise in assisting companies with the decarbonisation process and putting together carbon reduction plans. “We can help you baseline greenhouse gas emissions from across all your operations, so you know where to start,” says Chris. “We then use science-based methodologies to come up with your pathway towards net zero, ensuring a stakeholder lead approach. We can reduce your business risk by adhering to today’s environmental regulations and preparing you for any future legislation.”
Funding challenges are also often a significant roadblock to businesses taking action, explains Chris, but the benefits of future proofing your business and the cost savings over time help offset this. “Furthermore, we can identify cost savings and revenue opportunities that will have a positive effect on your productivity, profits and performance,” he adds.
Sign up below for Total Utilities Market Commentary to receive all the latest market news and insights.
